Specialist in Asia Pacific, Japan, China, India and South East Asia and Global Emerging Market equities.
Discover moreformerly Realindex Investments
Leader in active quantitative equities across Australian equities, global equities, emerging markets and global small companies.
Backed by a unique blend of research, portfolio construction and risk management, focused on uncovering original insights and translating them into investment strategies that are active and systematic, aiming to generate alpha.
Discover moreInvestment strategies
Insights
At Stewart Investors, we believe in putting people first. Our investment world-view is of a series of partnerships – with each other, with our clients, with the companies we invest in, the people who buy their goods and services, and with the wider society in which we all live and work.
Discover more
While many investors might understandably believe income and yield are the same, pursuing one over the other can deliver surprisingly divergent and apparently counterintuitive results.
In recent years, expected returns and income from traditional income asset classes have been low following years of global yield compression. As a result, investors have increasingly looked towards growth assets, like equities, to meet their income requirements. The standard strategy has been to target an equities mix that tilts towards higher yielding investments to match the desired portfolio yield target. This simple approach is often adopted because the terms yield and income are habitually used interchangeably when describing investment strategies - yet there are important differences!
In the chart below, we have split the attractive long-term income stream generated from Australian shares into two groups depending on their grossed-up dividend yield at 30 June 2003. We then look at the level of dollar income (the absolute level of income delivered in dollar terms) generated across the two groups since then. The green bars show the dollar income generated from stocks with the highest yields (top 50% of stocks), while the blue bars show the dollar income generated from the bottom 50% of stocks.
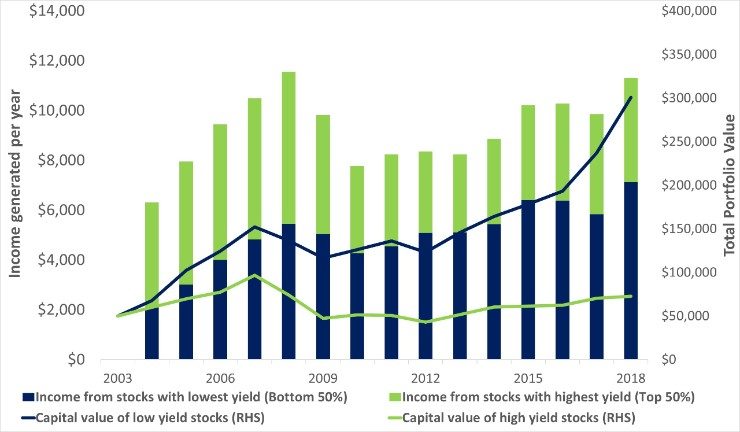
Source: Colonial First State Global Asset Management, FactSet.
Income and capital over 15 years calculated assuming a total investment of $100,000 equally weighted across all index constituents of the S&P/ASX 100 index as at 30 June 2003 that have the required 15 year price and dividend history (57 stocks). Data to 30 June 2018.
Interestingly, investors that targeted above-average yield stocks would actually have been worse off from a dollar income received perspective over the long term, even after accounting for the benefit of franking credits. Those with a keen eye might have observed that the high yield cohort produced higher levels of income in the first few years of the investment. That’s true, and it’s understandable that some investors prioritise this given the immediacy of their income needs. But the investment challenge for most investors is longer term in nature, including the generation of income over potentially long time periods in retirement.
What has produced this counterintuitive outcome? As the blue line in the chart shows, the lower yielding cohort collectively rewarded shareholders with a much higher level of capital growth. The lower yielding stocks’ delivery of greater long-term dividend income was not attributable to their dividend policy or yield, but rather their significantly higher total return, comprised of both dividend income and capital growth. Importantly, when it comes to income generation from shares, each year’s capital return provides the base upon which the following year’s income return is generated. This is the key to long-term dividend income growth. In short, strong total returns drive attractive income from equities over time. As noted by Rudi Minbatiwala, CFSGAM’s Head of Equity Income, “Maximising income and after-tax total returns from equities over the long term requires investors to consider yield and growth together, rather than focusing on yield alone.”
Stock examples might help to reinforce this message. Had an investor bought $100,000 worth of ‘high yield’ Telstra shares in June 2003 they would have received $136,201 in dividend income (including franking credits) over the following 15 years to June 2018. If instead they had purchased $100,000 worth of ‘low yield’ CSL shares in June 2003, the investor would have received $333,312 in dividend income. Why? Because CSL’s capital return has been 27.45%pa versus Telstra’s meagre -3.19%pa – helping to build a much larger base over time from which a lower yield can still derive a superior level of dollar income.
Does all this imply that the dividend yield concept is flawed? Certainly not. Dividend yield is designed to be a valuation metric that should be used in combination with other valuation metrics. The concern is that investors instinctively rely just on dividend yield as a proxy for future cash flow generation, despite the fact that it is the interaction of both income and growth that drives income from equities over time.
Important Information
This material has been prepared and issued by First Sentier Investors (Australia) IM Ltd (ABN 89 114 194 311, AFSL 289017) (Author). The Author forms part of First Sentier Investors, a global asset management business. First Sentier Investors is ultimately owned by Mitsubishi UFJ Financial Group, Inc (MUFG), a global financial group. A copy of the Financial Services Guide for the Author is available from First Sentier Investors on its website.
This material contains general information only. It is not intended to provide you with financial product advice and does not take into account your objectives, financial situation or needs. Before making an investment decision you should consider, with a financial advisor, whether this information is appropriate in light of your investment needs, objectives and financial situation. Any opinions expressed in this material are the opinions of the Author only and are subject to change without notice. Such opinions are not a recommendation to hold, purchase or sell a particular financial product and may not include all of the information needed to make an investment decision in relation to such a financial product.
To the extent permitted by law, no liability is accepted by MUFG, the Author nor their affiliates for any loss or damage as a result of any reliance on this material. This material contains, or is based upon, information that the Author believes to be accurate and reliable, however neither the Author, MUFG, nor their respective affiliates offer any warranty that it contains no factual errors. No part of this material may be reproduced or transmitted in any form or by any means without the prior written consent of the Author.
 |  |
|---|